Macro → Insert image
The Insert bitmap option in the Macros menu lets the user choose an image file and creates cell code that represents an image and chooses the image cell renderer.
Macro → Insert chart
The Macros → Insert chart... option provides an easy way of generating
matplotlib figures. They generate multi-line code. The last line is an expression that yields a matplotlib.figure.Figure object.
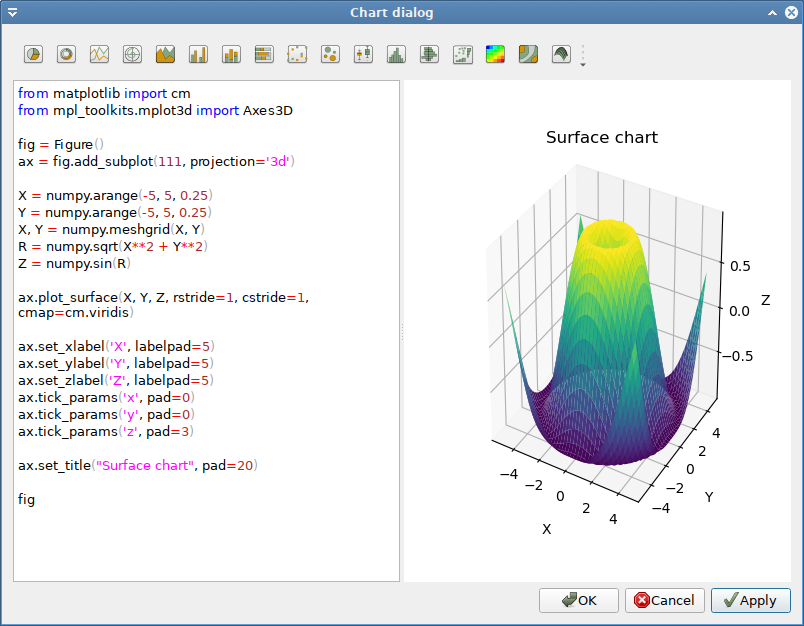
The dialog comprises a toolbar with several chart types, an editor on the left and a chart preview on the right side.
Clicking on a chart button inserts code for the respective chart at the current cursor position. The code is meant as template for users, who want to quickly create and edit common chart types. However, any matplotlib chart can be created in the editor.
The preview is updated when pressing the Apply button. If an exception occurs of if no Figure object could be retrieved then an error message is displayed.
Pressing the Ok button puts the code in the editor in the current cell and activates the matplotlib renderer.
For further reference on how to create charts, the matplotlib web site is recommended.
Starting from version 2.2, there is a second toolbar with R charts. These comprise examples using plotnine (ggplot2 based) charts as well as charts from rpy2 using the R modules graphics, ggplot2 and lattice. If the relevant R modules are not installed, the respective buttons are disabled.
Note:
With the upcoming Python 3 version of pyspread (i.e. v. 1.99.0+), the chart dialog has been completely rewritten.
For easier transition from previous versions of pyspread, the special class charts.ChartFigure is provided. This class subclasses the matplotlib Figure class. The subclass takes matplotlib arguments and creates a figure in one step. It is recommended to replace code that uses this class.
Macro → Quote
Puts quotation marks around the cell code. This makes the cell content of each selected cell interpreted as a string.
Macro → Money (requires py-moneyed)
Converts the content of the selected cells cell into a Money object. This requires the optional dependency py-moneyed. Currency follows the Money default currency that can be set in File → Preferences.
Macro → Datetime
Converts the content of the selected cells cell into a datetime object.
Macro → Date
Converts the content of the selected cells cell into a date object.
Macro → Time
Converts the content of the selected cells cell into a time object.
Macro → Insert sum
Inserts code into the cell below the bottom left cell of currently selected cells that sums up the content of the seleted cells.
Note that for summation, numpy.sum is employed so that e.g. string objects cannot be concatenated this way.
 Home
Home
 Install
 Docs
Docs
 Contribute
 API Docs
 Issues